


Content Summary
Access this content
Choose an option below
Your content has been opened.
Register to access this content
Verify your email to access this content
Code sent. Enter it in the modal
Your content has been opened.
Why do I need to verify I’m human?
Please verify you are a human before opening this content.
Your content has been opened.
The content will open in a new window. You may need to allow popups for this site.
Check your inbox
BI vs. VI: Improving Performance with Visual Intelligence has been emailed to . Entered the wrong email?
Don't see the content in your inbox?
Make sure to check your spam and other messages folders.
Can't get to your email right now?
By accessing content on the Insurance & Technology Online Buyer's Guide you agree to our Terms of Service and Privacy Policy; and, you acknowledge that your information may be shared with the content publisher.
You might also be interested in
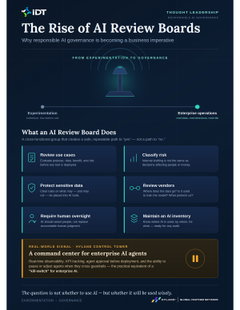
The Rise of AI Review Boards
As Artificial Intelligence moves from experimentation into everyday business operations, organizations in Insurance and Human Resources are facing a new governance challenge: how...
Read More
The Most Efficient and Compliant Temporary Vehicle Registration with Quick Tags by Fairfax Software
We at Fairfax Software are proud to offer innovative solutions like Quick Tags and Quick Snippet that streamline your business operations and improve efficiency. Our Quick Tags...
Read More
Data Migration for Insurance Agencies: Challenges, Strategies and Techniques
Embarking on digital transformation is a challenging yet essential endeavor for insurance agencies aiming to enhance their operational efficiency, customer satisfaction, and...
Read More